 Print this Article
Site Statistics
This document provides information about site statistics. Topics include checking disk space and bandwidth, accessing system logs, viewing account information, and getting information about visitors through Webalizer.
Checking Disk Space and Bandwidth
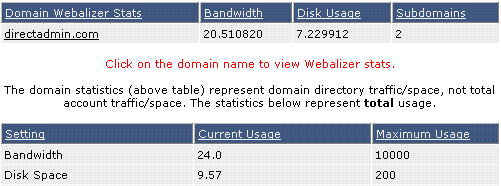
To check disk space and bandwidth usage, click on the "Statistics" icon from the main control panel menu. At the top of the screen you will see these tables:

The numbers in the tables represent megabytes, and approximately 1000 megabytes = 1 gigabyte.
You are provided with two different disk space / bandwidth measurements. The first table lists usage by domain and the second table lists total usage. Total usage is generally higher than domain usage because total usage statistics include factors that are separate from your domain, such as MySQL databases and control panel use. It is possible to host several domains on one account, so separating domain and total usage is necessary.
Note: DirectAdmin uses total usage (not domain usage) to determine when quotas have been exceeded.
Accessing System Logs
At the top of the Statistics menu are three text links: "Backed up Apache Logs," "Apache Usage Log," and "Apache Error Log."
Backed up Apache Logs
Clicking the "Backed up Apache Logs" link will bring you to a File Manager screen containing a list of .tar.gz files named by domain/subdomain and month. For example:

Here we see four backups for the month of April: the subdomains (admin, newsub, and reseller), and the backup for the main domain (Apr-2003.tar.gz). Backed up Apache logs contain both usage and error data.
Click on the file name of the backup to download it.
Note:
Log files are owned by the server administrator and cannot be deleted. Log files do not count towards your disk space quota.
Apache Usage and Error Logs
Apache usage and error logs can be viewed directly by clicking on the "Apache Usage Log" or "Apache Error Log" link.
The raw logs appear in a large text box that looks like this:

The above image is an example of an error log. Viewing raw logs are a great way to troubleshoot specific problems, such as installing and executing scripts. Both logs (usage and error) are backed up monthly and archived in /home/domain.com/logs. Please see the previous section ("Backed up Apache Logs") for more information.
Viewing Account Information
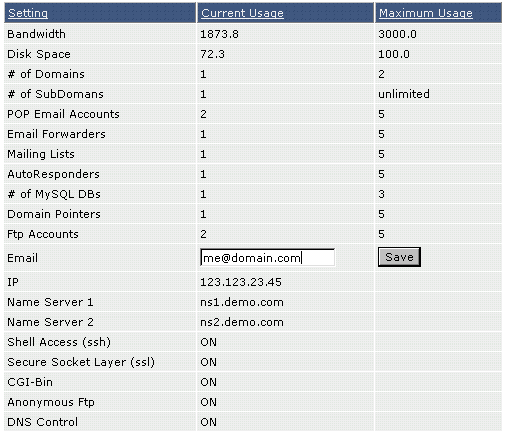
The main Statistics menu provides a great deal of information. As mentioned above, the first two rows of the table (Bandwidth / Disk Space) provide total usage. That is, DirectAdmin uses these numbers for quota purposes (and not the numbers in the Domain Statistics table -- see first section entitled "Checking Disk Space and Bandwidth").
When your account reaches the maximum bandwidth usage, your site will stop functioning until the first day of the next month. When your account reaches the maximum disk space usage, you will not be able to upload to your site until some files are deleted.

The information in this table is self-explanatory and will not be discussed in depth. If you haven't done so already, please set your current e-mail address in the "Email" field and click "Save."
Webalizer Statistics
In the main Statistics menu, click on the appropriate domain name to launch Webalizer. Please note that your site must be up for 24 hours and have some log activity before Webalizer statistics will become active.

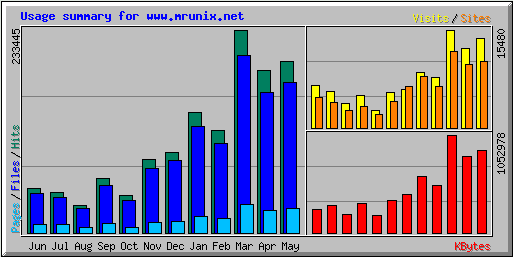
At the first Webalizer screen, you will see a chart (like the one above) and a list of months in a table below. Click on the month you want to view. Webalizer statistics are very detailed and will provide a great deal of information about site traffic, most requested URLs, exit points, location of visitors, and much more.

